
Scanning For Forensic Criminal Defense Presentations
Winning Cases by Using Cutting Edge Digital Scanning Equipment: Taking Animation and Jury Presentations to a New Level
3D Laser Scanning is a rapidly growing technology sweeping across the nation. While the technology is relatively new, it is now being embraced by law enforcement agencies, federal crime agencies, the secret service and major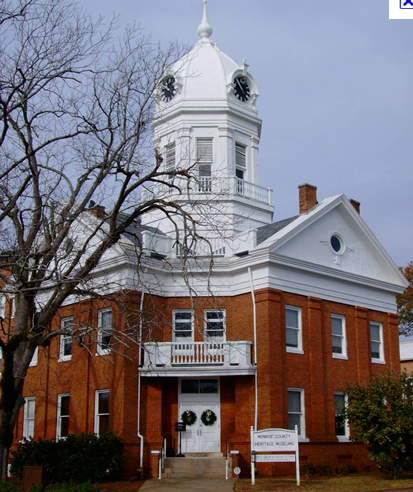 police departments all over the world. This technology gives the crime team and defense team ways to capture and show crime scene information that was not available until a few years ago. The technology literally allows either team, the prosecution or the defense, the ability to bring a scene into the courtroom so that everyone can view it. It has been praised by Georgia trial judges. Just this month the Georgia Bureau of Investigation has begun using a 3D Laser Scanner.
Laser Scanner Data in Court
“To my knowledge no laser scanner data properly presented has ever been ruled inadmissible in any court in the United States. In fact many police departments and federal agencies use scanners to collect evidence for all types of criminal and civil investigations. It is the best way available to collect data. The data is so graphic and intuitive that it is very easy to see the results and make logical judgments and precise measurements.” (Forensic expert)
(See Appendix A for Court and Forensic Case Examples)
It has even made its way into the media forefront in shows like Crime 360 and CSI. This technology is here to stay. It is accepted and has become the benchmark for clear and concise presentation of very complex crime scenes.
How does the technology work?
 Broad Specifications
- 50,000 Data Points Collected per second.
- Range 300 yards
- 360 Degree Color Photography
- Able to produce ¼ inch accuracy
- Fly through Videos
- Extremely effective at capturing the scene
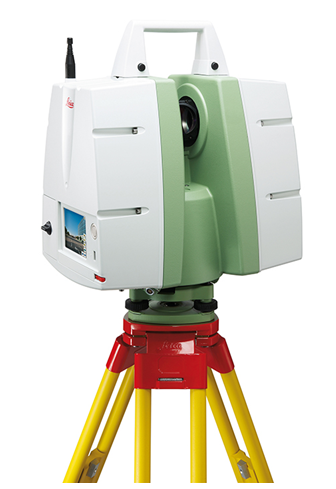
Leica C 10 3D Laser Scanner
The technology was invented about 15 years ago to map very precise structures like oil refineries. Originally it could only be used by trained scientists. However, in about 2000 the technology became much more user friendly, and by 2005, with the addition of an onboard color camera and compact platform, it quickly became state of the art. Now in 2011 it is becoming a very effective working tool for capturing existing conditions in any environment. Now it is use in thousands of different types of data capture task all over the world.
How does it operate? You turn the scanner on and it captures a 360 degree spherical photograph of the area. When the photographic collection is complete the scanner fires a laser at a rate of 50,000 times per second at an effective distance of 150 yards in all directions of the sphere. The laser beam travels out, hits an object and returns the position and elevation of the object and that is one point. The results of collecting millions of these points builds a 3D image that looks like a “hologram” and is called a point cloud. The points are registered to the color photography and are painted with the same color as the pixels in the digital photography and so the points collected are colored and measurable to an accuracy of about ¼ of an inch. All the data is graphic and represents the most precise way that you can capture data. We have been using this technology at LandAir Surveying for the last 7 years which has allowed us to become very proficient with the many tools it provides.
What tools does it give you that you do not have?
- You have 360 degree photographs of the scene, and you can walk a jury down the road or inside a house and let them look at everything in every room in color from any view.
- You can overlay the scan data over the photographic data and make precise measurements between any two points real time while testifying.
- You can place a virtual camera anywhere within the 3D scan data and view the scene from infinite points of view.
- You can build a fly through video and take the jury down the road at any speed you choose. For Example, you can show the scene in slow motion and then speed up the camera to actual speed showing a car traveling at 40mph per hour, thus demonstrating what the driver saw and viewed at that speed. You can then show the same scene in slow motion so a jury can study the details.
- Inside a house you can show a room or scene from any view and show the jury what a homeowner would see looking out of their window and what a person outside would see looking in from the street, and everything would be geometrically perfect.
- The information collected can be used to build a re-creation of an accident or crime and can show your version of how the crime or accident most likely occurred.
 All of this is done with photography and scanned points that are registered together and which are scientifically calibrated and precise. These tools are very powerful communication tools and judges like them because they save the jury trips to the site. Police departments all over America are now starting to use this method to document their crime scenes and present their evidence of a crime. They are able to use the information collected to show line of site details and what perpetrators and victims saw from different points of view. If new evidence comes up a year later they can make new measurements from the original data.
How much does it cost?
Most jobs consist of field data collection and a good scanning group should be able to get 8 to 10 set ups per day with a long range scanner which includes the 360 degree spherical photographs. The data is then processed and a video for the client is made. For example driving down the center of the road at some speed, and the ability to view and manipulate the photographs on the provided FREE software call “TrueView”.
This basic package can cost from $3500 for a relatively small site and of course the cost goes up as the size and the complexity of the project increases. This is sufficient to take into court. Smaller jobs may include scanning four ways down a busy intersection. Anyone can use the software provided to run the Windows Media files and open and view the 360 degree photos. In complicated cases we also can build accident recreation videos showing the accident as we believe it happened based on the facts this takes more time and cost more.
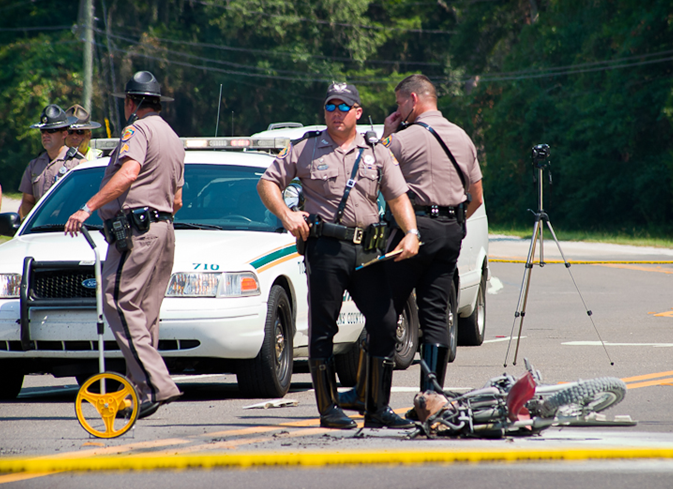
When the bus accident occurred on I 75 and Northside Drive in Atlanta the scene was scanned to collect data. When the bridge collapsed in Minneapolis the scene was scanned. When Princess Diana died in a car accident in a tunnel in Europe that became to most scanned accident scene in the world.
There are many more uses of the data depending on what a legal team needs in order to show their version of the incident. For example, we can create multiple views of the same situation to show what somebody may or may not have been able to view of an incident based on where they were standing. We can create camera views at eye level in a car or at eye level of a bystander standing next to a pole. We can insert realistic car models into a video and show the view from the windshield looking out. We can show the same car as viewed from the top of an overpass as it drives under the overpass. All this comes from the original data collection.
What steps are necessary to use the information and make a presentation in court? Below are the actual preparation and steps for one of our recent court cases.
This case involved working with a criminal defense team to help defend Joe Client. He was charged with vehicular homicide and the case had been moving through the system for 5 years.
Step 1. We met with the defendant and all the defense attorneys and walked the site to determine what was important to them. We discussed all the facts and looked at what little evidence remained at the scene. We listened to our client tell his version of the incident. Our task was to clearly document the site to show the court.
Step 2. We reviewed the photographs that were 5 years old and begin to study the evidence. We were provided police reports, photographs and other pertinent information regarding the case.
Step 3. We discussed with the defense attorney the area to be scanned for the presentation.
Step 4. We collected the scan data and 360 degree photographs of the site. This took about a 2 days.
Step 5. With our processed data and photographs we met with the defense team and presented several site videos of the travel of the car as it had been described. We determined that we would produce one video example in slow motion for detailed study of the scene and a second at real time speed.
Step 6. We began to build sequence boards that would be the basis for the design work of the accident re-creation video presentation. We used the photographs, the evidence, the police reports and the scan data to build the information needed.
Step 7. We produced our first animation in black in white and delivered it to the defense team for their input. The team was very impressed and enthusiastic and immediately started giving us input and making great suggestions.
Step 8. We produced a second version and then a final version of the re-creation that we would present in court. We were convinced that we had made the re-creation as close as possible to the police reports and to our client’s account of the accident.
Step 9. We presented the final version to a mock jury. They are obviously taken with the realism of the animation and immediately understood what took place . They voted for acquittal. We used their input to make a final adjustments to the video recreation.
Step 10. We went to court and were prepared to show the court how the technology works, show the digital video fly through, the 360 photos showing the accident scene and finally the accident re-creation. During pretrial motions we were told to go in the empty jury room where we presented all our information to the prosecutor with the defense team and we were question at length by the prosecutor as to the technology and the data collection process. The case was settled on a plea later.
Conclusion
3D Laser Surveying is now starting to become a forceful forensic technology that can be used to bring data to court cases that was not available even 5 years ago. This is the most advanced way to collect crime scene and civil accident data and has been used in many courts across the country. This method is currently being used in all types of civil and criminal litigation including civil cases and insurance case where a catastrophic even or arson has taken place to bring the scene to the courtroom and show them scientifically, graphically and intuitively what the environment in which a civil or criminal incident looked like, and it allows for permanent 3D archival of the area involved.
H. Tate Jones Ga. RLS
Contact information tjones@lasurveying.com
1875 Old Alabama Road Suite 1120 Roswell, Ga
770 730 9950
Appendix A
Court and Forensic References
(Norcross, Ga., 03 September 2009) District Attorney Joe Mulholland of the South Georgia Judicial Circuit added yet another legal case reference to the growing number of U.S. court cases in which Leica Geosystems 3D laser scan data has been admitted into evidence when he successfully proffered and tendered to the jury a visually compelling Leica TruView.
During the murder trial of Antonio Jerome Greenlee in Decatur County Superior Court, witness and crime scene investigator, Andy Forte of the Thomas County Sheriff’s Department, used Leica TruView to virtually place the jury at the crime scene and to show them how the homicide could have occurred. The case stems from the homicide of 21-year-old Ebony Clarke of Bainbridge, GA, who was shot and killed on August 12th, 2008, during a street altercation between two men.
Leica TruView is a free, web-enabled panoramic point cloud viewer that allows users to view, pan, zoom, measure and markup the incredibly rich point cloud captured by the Leica ScanStation 3D laser scanner. The Leica ScanStation allows investigators to first photograph and then make millions of measurements of a crime scene in just a few minutes thus “freezing the scene in time” forever. A Leica TruView data set can then be generated in minutes after scanning for briefings or analysis or as in this case as a jury exhibit.
“The jury really, really liked it and we had jurors comment afterwards about how effective it was” said District Attorney Mulholland. “We not only used the TruView to support Andy’s testimony, but the judge then allowed Andy to show it again during my direct examination of other witnesses as I asked them questions about where they were standing or where the shooter was. TruView is basically a high-tech picture. It is not testimony. It is offered as an exhibit and demonstrative evidence. This seemed to play well with the judge. The Defense did not object and I think that they thought the same thing.”
Mulholland went on to say that after the trial the judge called him to the bench and commented on how effective the use of the Leica TruView was and encouraged him to use it again. “We certainly plan on doing so. The scanning software was absolutely fantastic” said the D.A. The judge also contacted Thomas County Sheriff R. Carlton Powell to thank him for his agency’s assistance with the case and to compliment him on the professional nature of the exhibits generated by his investigators. Sheriff Powell was instrumental in bringing ScanStation technology to Georgia law enforcement and has made it available to the Georgia Bureau of Investigation and other agencies as a courtesy.
- California DOJ Invests in 3-D Crime-Scene Laser Scanners to Support Forensic Crime Scene InvestigationAfter seeing first-hand how the Leica Geosystems ScanStation 2 can be deployed to quickly measure and model extensive indoor and outdoor mass casualty mock crime scenes, the California Department of Justice’s Bureau of Forensic Services (BFS) moved quickly to purchase two Leica ScanStation 2 high speed, high definition 3D laser scanning systems from Leica Geosystems.
- Pennsylvania State Police Response to Amish School Shooting
- The Amish School shooting occurred on the morning of Monday, October 2, 2006 when a gunman took hostages and eventually killed five girls (aged 7–13) and then killed himself at West Nickel Mines School. The Pennsylvania State Police used a Leica laser scanner at the scene for forensic mapping.
- Albuquerque Police Chief Ray Schultz discusses the reasons his department acquired a Leica ScanStation for crime scene investigation.
- This BBC news clip shows British Police Investigators in the Paris tunnel where Princess Diana died using a Leica 3D laser scanner.
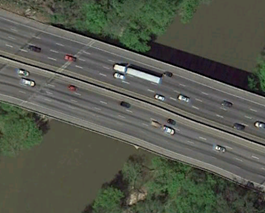
- 3D Scanning: Laser Scanning the I-35W Bridge Collapse
Professional Surveyor Magazine – March 2008
Bruce Jenkins
Much has been made of the role aerial mappers and surveyors have played in victim rescue and bridge reconstruction after the August 1, 2007 collapse of the I-35W bridge in Minneapolis. But what about laser scanning? This is the story of how the Minnesota Department of Transportation deployed 3D laser scanning to capture a detailed forensic record of the bridge collapse and help with the ensuing investigation.
 LandAir Surveying began doing business in the 1988 by offering site and topographic surveys to the engineering and construction industry. The company originally started with two survey crews. There were fewer than ten employees and surveying services were offered in Georgia and nearby states. Over the next ten years the business expanded tremendously to include cell tower site surveying services to telecommunications providers. Three-thousand or more cell tower sites were surveyed with conventional survey methods. In 2002 there was a shift of focus to transportation engineering projects and in 2005 we got a project to survey the I-20 Bridge over a large river near Atlanta, Georgia. It was this shift that transformed the technology used and overall business direction of LandAir Surveying. Problems arose with the traditional surveying methods. The size and length of the bridge made it difficult for a survey team to get an accurate survey with the traditional survey equipment. Our owner sought alternative solutions and in the process determined that 3D laser scanning could be used to achieve more reliable results for the bridge survey.
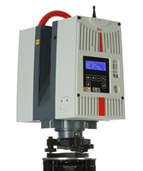 came calls for exterior, interior, and structural surveys of various buildings and environments. 3D laser scanning made it possible to easily scan a building and produce drawings and 3D data sets based on the scan. Time required to produce an accurate survey was reduced with the help of this technology. Enhanced scanning allows surveying of building areas that are not easily accessible without the technology. Larger jobs such as wide spread manufacturing facilities have more accurate site surveys with complete 3D imaging and laser scanning is becoming more of a standard in these environments. These types of surveys would not be possible with traditional surveying methods. Data processing had to be refined to better handle bigger data sets created by laser scanning. New scanning innovations have created safer work environments for surveying crews and new business opportunities.


