3D Scanners in an efficient data collection process
Understanding How to use 3D Scanners in an efficient data collection process.
There are a few legends and myths about Laser scanners that should be cleared up at the beginning of this article. First; Laser scanners do not penetrate anything.

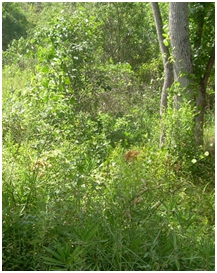
Example: of foliage that would prevent a scanner from touching the ground.
You will hear very often that a scanner can go down through deep grass and or thick foliage and always finds the ground. This is simply not true. The laser beam will find the lowest point of return before the light no longer returns to the scanner. Sometimes you will hear or read dialogue talking about first return and last return. A good example of this is a tree. The laser beam can hit the ground the bushes then a tree trunk then the bushes then the ground. It cannot really differentiate between the low part of the tree it hit and the ground. All it detects is that it collected a point. There is some very interesting technology call Full Wave-Form Technology that can measure the strongest point of the return and increases the chances of finding the lowest point or the hardest point but that is a discussion for another article. Much research is being done in this area. The short version is this if you use a Laser scanner to measure ground beneath foliage you are not going to get survey quality results. I attended a presentation of what at first appeared to be a very good project example of a dyke survey in New Orleans after Katrina. The problem that was not overcome was that the grass was about 18” high all over the dyke. The presenter suggested and showed a method of cutting cross sections to pick and find the lowest point or the “ground shots”. The results were very inconsistent. The surface that was generated was sometimes the ground and sometimes the top grass and sometimes somewhere in between.
So what is the typical scanning method and best practice?
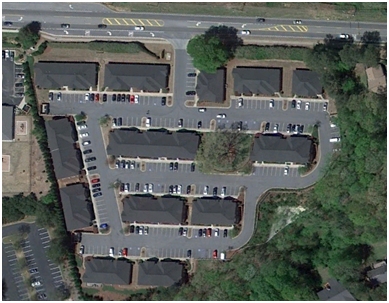
While all jobs are different they all have certain processes in common. For this example let’s say that we are going to scan a small campus with several buildings and roads. ( See example below) The job is to create a DTM (digital terrain model) surface and building footprint and elevation views.

Example of Campus Scan mention above
The first step is to bring in some type of survey control. Normally two or three GPS survey grade control points. This will tie the area down on a known coordinate system and allow the users to find it on known data bases like Goggle Earth or local or state GIS database information. To start the scan we typically place two or three targets on the control points to tie down the coordinate system. Using this example we would scan the road in front of the campus and then the fronts of the buildings. However notice that there is a hedge between the road and the buildings this will cause several extra set ups to get between the hedge and the road. Then we would scan through the parking lots and the fronts and backs of all the buildings. Again we have to take into account the close foliage adjacent to the building but in this case it will have minimal effect on the number of scans. To scan the roads in front of the campus would likely take 3 to 5 scans. To scan the front of the buildings you would set up your scanner on the front right side of the top left building so you are getting the side and the front, then again in front of the building again at a point in front of the gap between the buildings continuing on down the line of buildings so that you whenever you can you are scanning the front and sides of the buildings. When you scan behind the buildings you will also scan at points in front of the buildings and between the gaps. The point is two always scan as many surfaces as you can from one set up. Note that when you are scanning the back of the front buildings because of the range of the scanner you are also scanning the front of the buildings in the next row. At the same time we shoot a series of pictures at each scan points that allows us to produce 360 degree photographs at each set up. I will go into the photography in more detail in a later article at this is one of the most powerful tools in Laser Scanning.

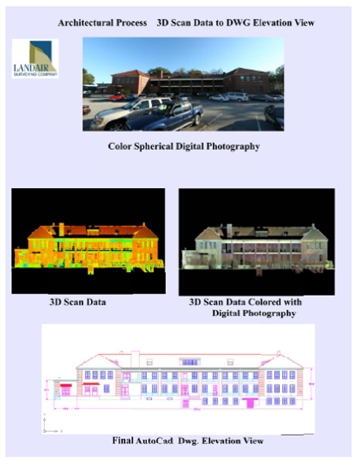
3D Scanning Process from Start to Finish
Using this process you could scan the above campus in about 12 to 16 hours depending on the type of scanner you used. Because there are not really long site lines the preference would be to use a high speed phase based scanner on most of it and perhaps a long range scanner in front on the campus along the road.
When the scanning is completed and the data is processed and registered you can export the information into cad software and then produce the final products of elevation views and a DTM surface model. AutoCAD and Micro Station are still the most common software’s used for this. In the example to the right you see a photograph of a building then the, the scan data that is untouched. Then you see the scan data after we have colored the points with the photography and then calculated the elevation views of one side of the building. Just by looking at this example you can see how much more data you get compared to the normal survey using a total station and drawing it in cad. An interesting note in looking at and viewing scans is that there is always more space between the points than the points take up so you always are looking at opaque views that look more like water colours than photographs. Because of this when you are using software you can see through signs so when you look at a STOP sign from the other side is appears as POTS with the letters reversed.
